03 February 2017 | Blog
The true cost of a bad customer experience during disruption: An on-time performance use case
03 February 2017 | Blog
The true cost of a bad customer experience during disruption: An on-time performance use case
The latest on-time performance results have been released by OAG, highlighting the best and worst airlines and airports for on-time performance (OTP) – analysing everything from long-haul journeys to one-hour connecting flights.
Aside to where exactly an airline (or airport) sits on the list, the report highlights the sheer scale of travel disruption - how passengers across the world continue to face long delays and cancellations that are often outside of an airline’s control. Take last year’s East Asia Cold Wave or the US Blizzards for example.
Whilst man and technology cannot control these forces of nature, they can control whether the customer has a good or poor experience at a time when they’re under the highest levels of public scrutiny.
How?
By keeping customers, staff, and subscribers up-to-date with real-time, personalised flight status information - delivered on the channels most relevant to them. When managed like this, IROPS can boost brand sentiment and minimise the impact of lost customer loyalty on an airline’s bottom line.
So how much are we talking about?
Using industry predictions, external benchmarks and the OAG report, our team at 15below have done some serious number-crunching. The results? The following calculations illustrate the financial impact of a bad customer experience (because of disruption) for airlines – money that could be saved by having the right technology in place.
Mainline Airlines
Firstly, looking at Mainline airlines within the OAG report – the top 20 performing airlines have average 85% OTP rate. This conversely equates to an average 15% rate of disruption. Passenger volumes are looking at mid- and high-end passenger capacities.
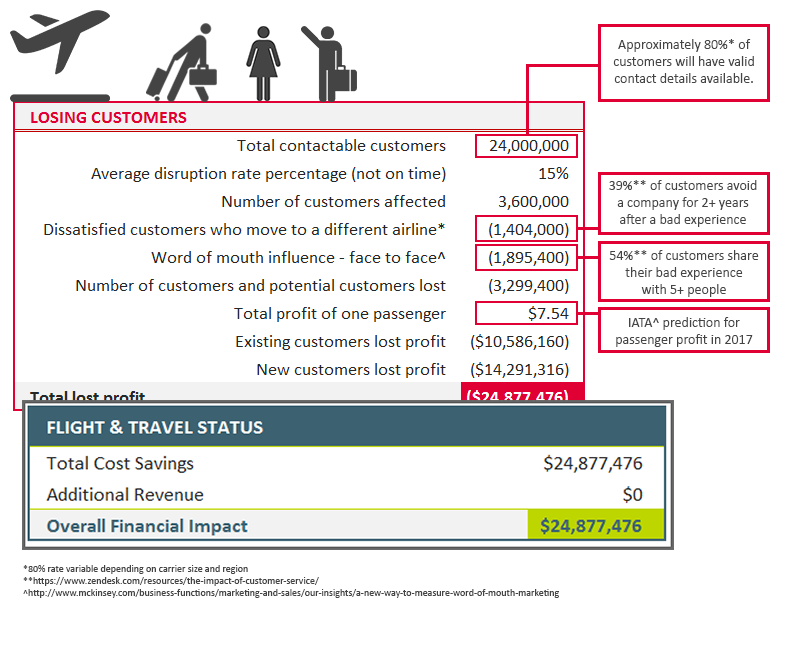
Scenario 1: Mainline Airline with 85% OTP (75 Million Passengers)
Estimated Annual Profit: $565,500,000

Scenario 2: Mainline Airline with 85% OTP (30 Million Passengers)
Estimated Annual Profit: $226,200,000
LCC Airlines
78% OTP is the average of the top 20 LCC airlines within the OAG report, indicating a 22% rate of disruption. Passenger volumes are looking at low- and mid-range passenger capacities.
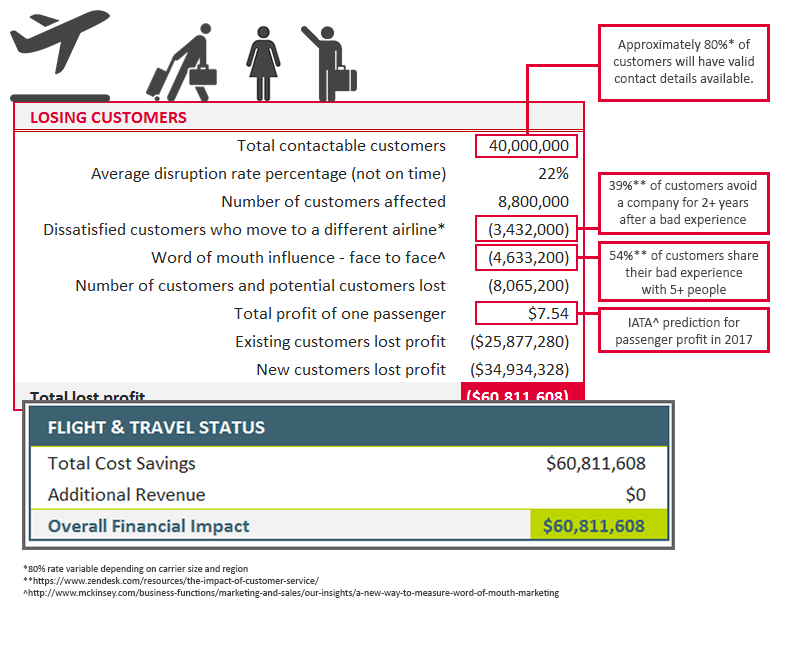
Scenario 3: LCC Airline with 78% OTP (50 Million Passengers)
Average Annual profit: $377,000,000
Scenario 4: LCC Airline with 78% OTP (5 Million Passengers)
Average Annual profit: $37,700,000

NOTE: These calculations don't consider set up costs for new airlines or additional costs incurred by an airline which is not managing disruption well - namely a surge in customer service enquiries and the manpower needed to support this.
Based on the calculations above, disruption could impact airline profits by up to 7% - which sounds small until you see costs reaching the tens of millions. Getting the right information into the hands of the right people (passengers, ground staff and third-parties) goes a long way in smoothing the journey, reducing traveller stress and (to some extent) reversing the financial impact of disruption.
For more information on how we can help you with flight status communication, please get in touch.